We recently have been doing similar tests around Web 2.0 properties, seeing which Google values the most at present. Given that there are a bunch of different Infographic sites around and we often use these for publishing infographics in SEO, we thought, why not find out which Google likes the best?
For this test, we set up a page with a 400 word article and with a keyword density of 2%. We optimized the test page for the test keyword and then, also published the infographic on the test page with the keyword as the alt tag.
We then selected the top 20 infographic sites (ended up being 18, after 2 were cancelled) we could find. These were specifically infographic sites, not general visual content publishing sites such as Pinterest. We created an account using the same data, published the same infographic with the same keyword in the description pointing back to the same test page where the infographic was originally published.
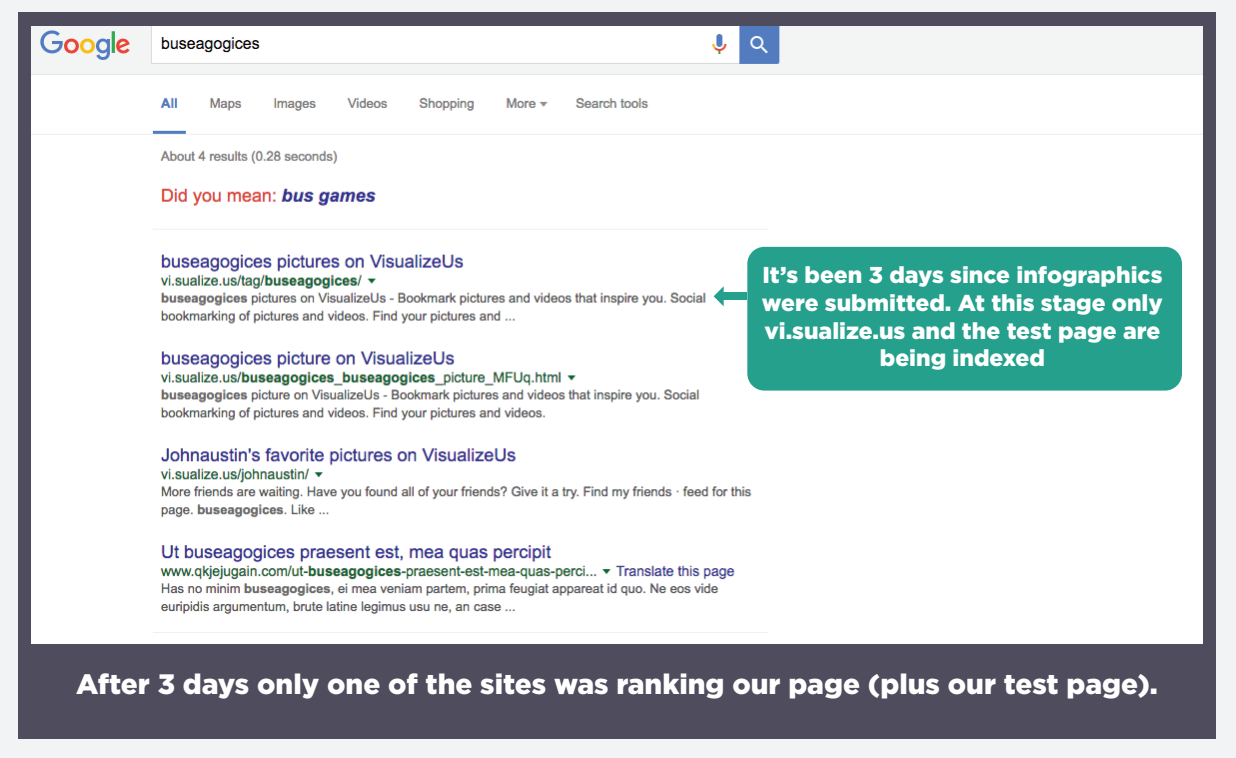
Below are the SERPS three days after submitting to all the infographic sites.

Results
Three days after submission, only vi.sual.us is being indexed so far. Most of the infographic sites have manual review so we have to wait and see which ones get approved and where they rank. This test could take a few weeks and we will be providing updates on the results.
Clint’s Feedback
Check out Clint’s video on this test and his insights on the use of infographics.
Today, we are going to do test 34 – What are the strongest infographic sites? This is from our link building phase back in 2016.
One of the ways that we were talking back then about link building is through the creation of infographics. It’s a method that still works pretty well today, especially if you’re doing a lot of data visualization stuff by turning word numbers into pretty little charts and stuff.
People that enjoy visual data like to consume content that way. It’s more of a clear and concise thing versus having to read an entire article.
I still recommend that you try this out. I don’t know about necessarily using the infographic sites anymore. They’re built out and burned out, everyone’s put their junk in there, and people stopped using them as a resource. But you certainly can do that.
You can promote them on sites like Facebook, Twitter, Flickr, and get a lot of bang for your buck.
As a matter of fact, Pinterest is probably the number one place where I recommend sharing your data, your graphs and your infographics and stuff. But with that said, this test is one of those that you would consider a dud.
The page ranked, but at the end of the day, only one out of the 20 infographic sites that were selected for the test indexed. That’s not really a good return on investment back then.
Today, we know that we just get it crawled and that link counts. But it’s certainly better if the site’s index, they have an audience there, and there’s people actually looking for those type of infographics. When they use yours, it’ll naturally creating backlinks.
The second benefit of the infographic type sites is some of those sites actually offer embed codes. It will then embed to the infographic site and those links will boost up the link that you have on the infographic site.
There’s some things that you could do there. But all at all, I think this was a busted test. And frankly, as I was looking through all the results, while making these videos, I didn’t see that this one was ever looked at again.
Maybe we’ll retest it and just see if we can find some better sites that you can share your infographics on to promote your content and then those shares result in traffic beyond just the backlink stuff.
Because we want to double dip. We want traffic and backlinks so we can get promotion for our content versus just waiting for Google to rank the sites or the pages better and getting traffic that way, we can get the traffic from the links that we’re building and the promotion that we’re doing and that promotion results in more backlinks in a natural way to keep us out of trouble. So that’s how I would implement the results of this.
Was that a cliffhanger? Head on to our test articles for the results of which infographic sites are the most effective ones to use.
